Awaiting US Jobs Data, Markets Turn Optimistic on Middle East; Relief Rally for Bonds and Gold
he Middle East remains in the spotlight for financial markets. The optimism that resurfaced among investors yesterday lifted the bond market — at least temporarily — and gave fresh momentum to the equity rally. In a risk-on environment, though still marked by elevated volatility, markets are hoping for a near-term diplomatic solution and are preparing for the U.S. labor market data due tomorrow. Futures point to a positive opening for both Europe and the United States.
Market Weather Map
May 7, 2026
US Equities
Eu Equities
Asia Equities
Commodities
Bonds
Dollar Index
Technology
Gold
Oil
Crypto
Market Summary
Financial markets sentiment
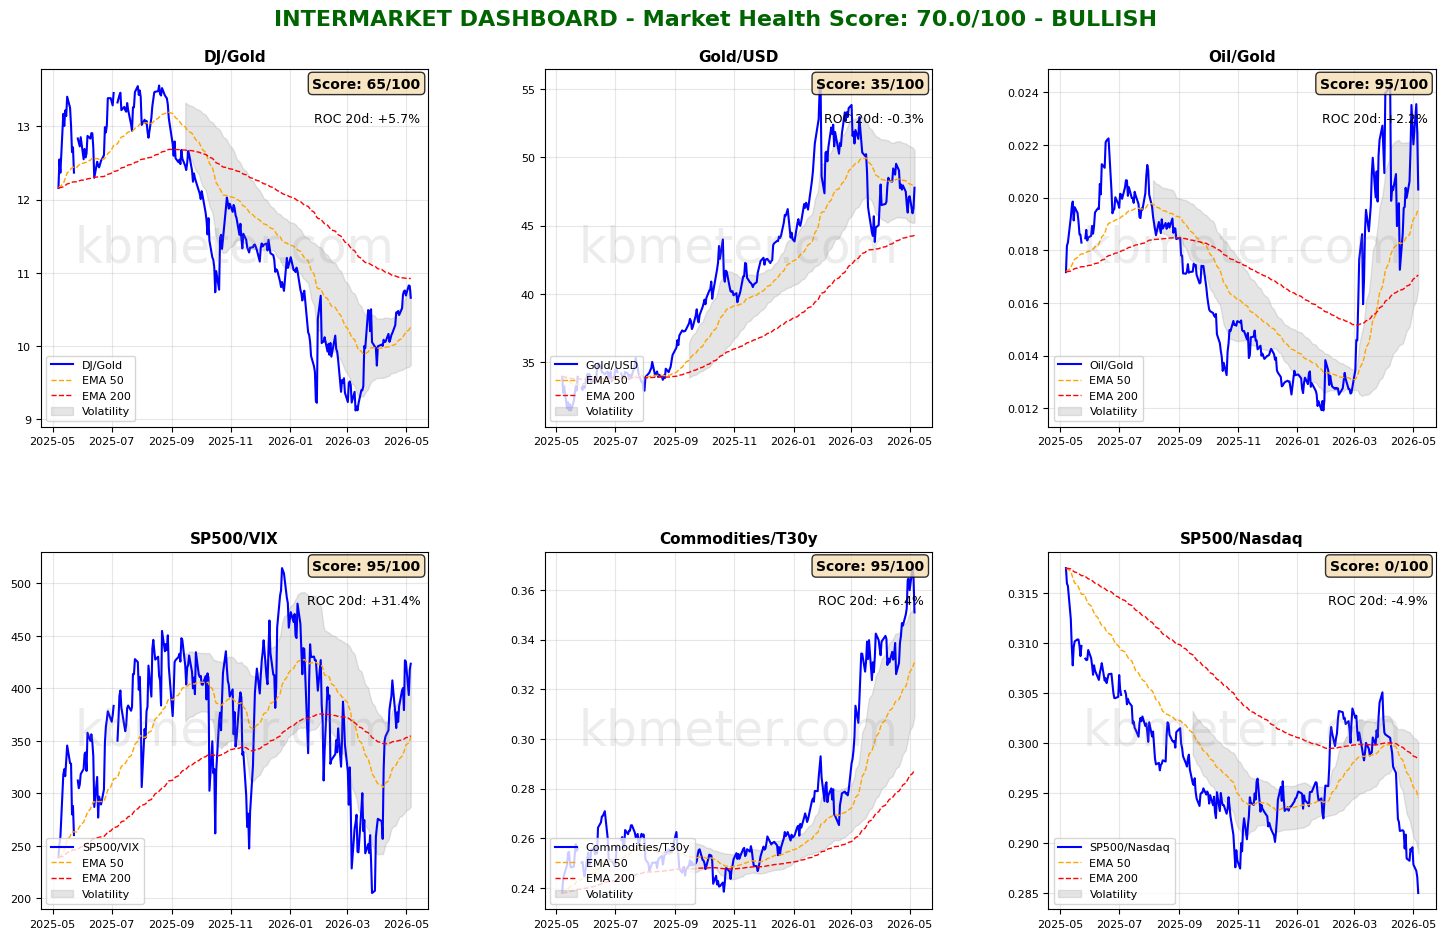
Financial markets are showing a moderately positive sentiment today. Intermarket analysis highlights a Market Health Score of 70/100 (positive). Our intermarket dashboards reflect the wave of optimism that characterized yesterday’s trading session across financial markets. Optimism surrounding the possibility of a U.S.-Iran agreement particularly benefited the bond sector. Gold also recovered.
While risk appetite indicators remain broadly stable, a closer look at asset classes reveals accelerating global equities and the bond market moving back above its 50-day moving average threshold.
Global Futures – Pre-Market Sentiment
Pre-Market Futures: Global futures are signaling a risk-on sentiment (average +0.54%), with the U.S. slightly positive (+0.07%), Europe positive (+0.55%), and Asia strongly positive (+1.16%).
📊 Global Futures – Pre-Market Sentiment
- FTSE MIB derived: +2.40%
- IBEX 35 derived: +2.30%
- Nikkei 225 derived: +1.74%
- DAX derived: -0.10%
- FTSE 100 derived: -0.03%
- US Tech 100 derived: -0.03%
Intermarket details
📄 Detailed Intermarket Analysis
INTERMARKET ANALYSIS - 2026-05-07
============================================================

MARKET HEALTH SCORE: 70.0/100
SENTIMENT: BULLISH

============================================================
SUMMARY OF KEY RATIOS
============================================================


DJ/Gold:
  - Component score: 65.0/100
  - Current value: 10.6603
  - Position vs EMA50: ABOVE
  - 20-day ROC: +5.68%
  - 50-day ROC: +11.77%
  → Preference for risk assets over safe havens

Gold/USD:
  - Component score: 35.0/100
  - Current value: 47.7647
  - Position vs EMA50: BELOW
  - 20-day ROC: -0.31%
  - 50-day ROC: -9.32%

Oil/Gold:
  - Component score: 95.0/100
  - Current value: 0.0203
  - Position vs EMA50: ABOVE
  - 20-day ROC: +2.16%
  - 50-day ROC: +59.54%
  → Growing energy demand

SP500/VIX:
  - Component score: 95.0/100
  - Current value: 423.5262
  - Position vs EMA50: ABOVE
  - 20-day ROC: +31.38%
  - 50-day ROC: +20.17%
  → Expanding risk appetite

Commodities/T30y:
  - Component score: 95.0/100
  - Current value: 0.3510
  - Position vs EMA50: ABOVE
  - 20-day ROC: +6.42%
  - 50-day ROC: +26.24%
  → Economic growth expectations

SP500/Nasdaq:
  - Component score: 0.0/100
  - Current value: 0.2850
  - Position vs EMA50: BELOW
  - 20-day ROC: -4.88%
  - 50-day ROC: -5.41%
  - ⚠️ ANOMALY DETECTED - Significant deviation from the average

============================================================
CONCLUSIONS AND RECOMMENDATIONS
============================================================

The market is showing broad signs of strength. Intermarket ratios suggest
a favorable environment for risk-taking. Elevated risk appetite and positive trends.
Positioning: CONSTRUCTIVE on risk assets.


STRONGEST RATIOS:
  • Oil/Gold: 95.0/100
  • SP500/VIX: 95.0/100
  • Commodities/T30y: 95.0/100

WEAKEST RATIOS:
  • DJ/Gold: 65.0/100
  • Gold/USD: 35.0/100
  • SP500/Nasdaq: 0.0/100

============================================================
Analysis based on kbmeter.com data
Date: 2026-05-07
📄 Detailed Asset Allocation Analysis
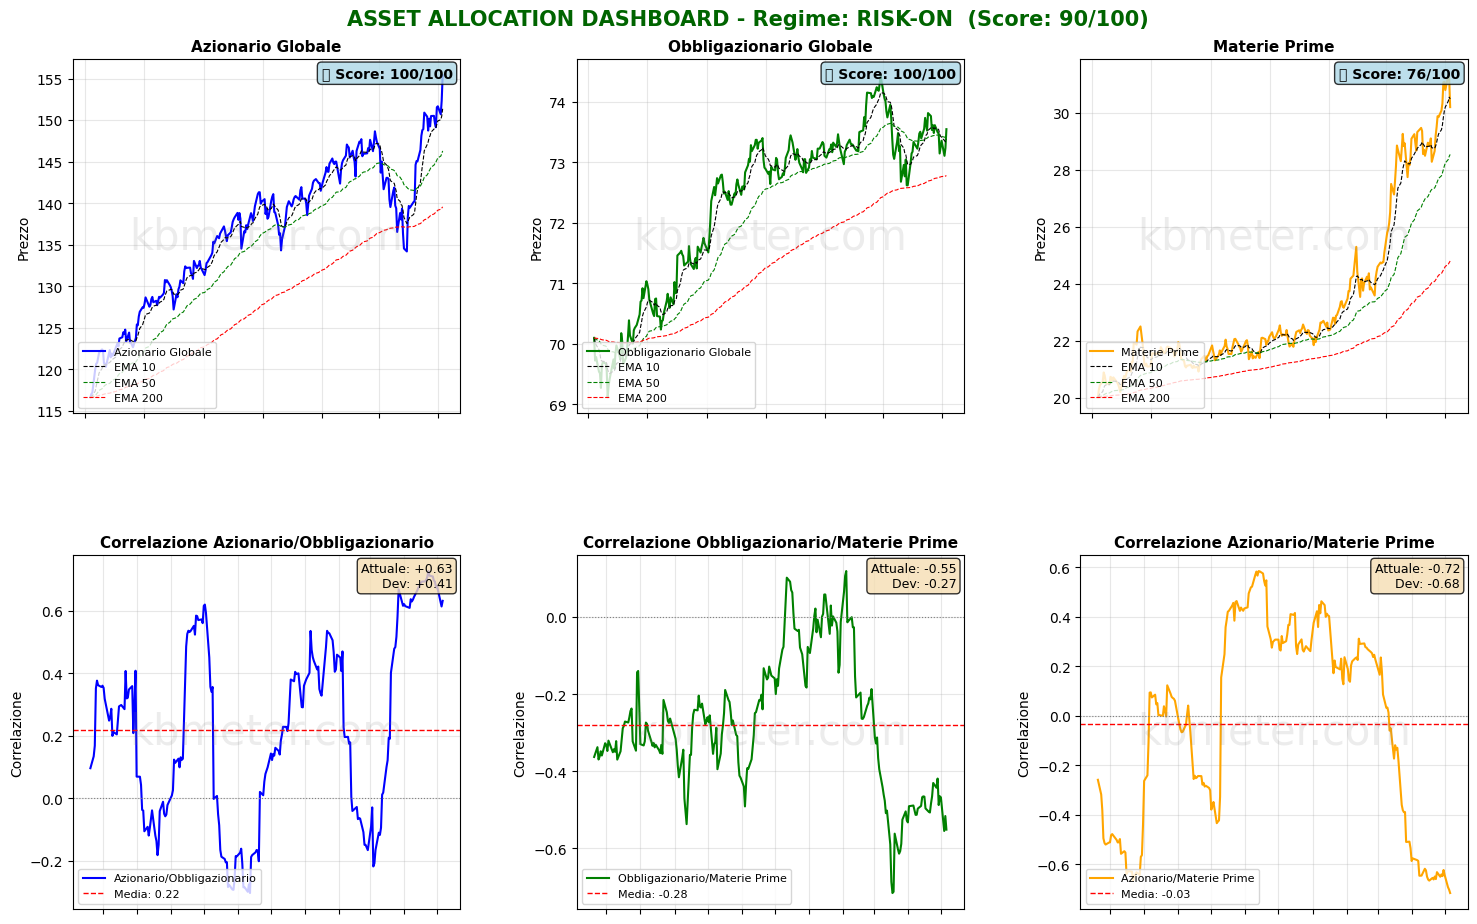
ASSET ALLOCATION & REGIME ANALYSIS - 2026-05-07
======================================================================

MARKET REGIME: RISK-ON
REGIME SCORE: 90.0/100

======================================================================
TREND AND VOLATILITY ANALYSIS
======================================================================

GLOBAL EQUITIES (ACWI):
  Short-Term Trend (5d): +2.55% | ABOVE EMA 10
  Medium-Term Trend (20d): +7.12% | ABOVE EMA 50
  Long-Term Trend (60d): +5.49% | ABOVE EMA 200

  5d Volatility: 17.3%
  20d Volatility: 13.5%
  60d Volatility: 17.7%

COMMODITIES (DBC):
  Medium-Term Trend (20d): +5.22% | ABOVE EMA 50
  20d Volatility: 22.9%

ACWI/BND Correlation (30d): 0.632

REGIME INTERPRETATION:
The market is in a risk-on regime. Equities are showing positive trends across multiple
time horizons and volatility remains contained. Investors are favoring risk assets.
Suggested positioning: OVERWEIGHT equities.

======================================================================
ASSET RANKING - WHO IS PERFORMING BEST?
======================================================================

🥇 1. Global Equities (ACWI) - SCORE: 100/100
     Price: $155.40
     Trend: ABOVE EMA10 | ABOVE EMA50 | ABOVE EMA200
     Performance: 5d +2.55% | 20d +7.12% | 60d +5.49%
     Volatility: 5d 17.3% | 20d 13.5% | 60d 17.7%
     Drawdown: 0.00%
     → Asset in STRONG HEALTH: positive trends and controlled volatility

🥈 2. Global Bonds (BND) - SCORE: 100/100
     Price: $73.55
     Trend: ABOVE EMA10 | ABOVE EMA50 | ABOVE EMA200
     Performance: 5d +0.40% | 20d +0.06% | 60d -0.27%
     Volatility: 5d 4.4% | 20d 3.8% | 60d 4.4%
     Drawdown: -1.20%
     → Asset in STRONG HEALTH: positive trends and controlled volatility

🥉 3. Commodities (DBC) - SCORE: 76/100
     Price: $30.21
     Trend: BELOW EMA10 | ABOVE EMA50 | ABOVE EMA200
     Performance: 5d -2.86% | 20d +5.22% | 60d +25.14%
     Volatility: 5d 28.0% | 20d 22.9% | 60d 24.8%
     Drawdown: -3.57%
     → Asset in STRONG HEALTH: positive trends and controlled volatility

======================================================================
CORRELATION ANALYSIS - CURRENT vs HISTORICAL
======================================================================

ACWI/BND:
  Current correlation (30d): +0.632
  Historical average (1 year): +0.220
  Deviation: +0.412
  ⚠️ SIGNIFICANT DEVIATION from historical average
  → Positive correlation: diversification COMPROMISED

BND/DBC:
  Current correlation (30d): -0.551
  Historical average (1 year): -0.280
  Deviation: -0.271

ACWI/DBC:
  Current correlation (30d): -0.716
  Historical average (1 year): -0.032
  Deviation: -0.683
  ⚠️ SIGNIFICANT DEVIATION from historical average
  → Negative correlation: possible supply-driven shift

======================================================================
OPERATIONAL SUMMARY
======================================================================

STRONGEST ASSET: Global Equities (Score: 100/100)
WEAKEST ASSET: Commodities (Score: 76/100)

SUGGESTED ACTION: Favor the strongest asset while maintaining risk exposure.
DIVERSIFICATION: POOR - Asset classes tend to move together.

======================================================================
Analysis based on kbmeter.com
Date: 2026-05-07
Macroeconomic Calendar
On the macroeconomic front, today’s calendar includes German industrial orders data and Eurozone retail sales figures for March 2026. From the United States, additional key labor market data will be released, including job cut announcements, unemployment claims, and first-quarter 2026 labor productivity figures. Consumer inflation expectations for April 2026 will also be closely watched.
On the earnings front, traditional economy sectors return to center stage today with results from McDonald’s, Rheinmetall, and Shell. Investors will also be watching earnings from Airbnb, CoreWeave, Cloudflare, and Motorola.
Already a subscriber? Login here
NOTES AND WARNINGS
Data compiled by kbmeter.com. Analysis date: 7 May 2026 - 7:54 AM GMT+1
This content is provided for informational purposes only and should not be considered financial advice. All scores and assessments are based on the previous trading day’s closing prices. Futures indications refer to the date and time of the analysis.