AI Remains Center Stage—for Better or Worse—in Financial Markets, as Sentiment Swings Between Neutral and Risk-Off
AI remains the main protagonist, for better or worse, in financial markets. The week draws to a close with renewed concerns about profitability and the potential disruption that new technology could cause in other sectors (from software to financial services). Investors remain nervous and overall sentiment fluctuates between neutral and risk-off, with significant sector rotation and stabilization in gold. January’s U.S. inflation data will provide further clues about the future of U.S. monetary policy. Futures indicate a flat open for Europe and a negative start for the United States.
Market Weather Map
February 13, 2026
US Equities
Eu Equities
Asia Equities
Commodities
Bonds
Dollar Index
Technology
Gold
Oil
Crypto
Market Summary
How to interpret our financial indicators? Find out here.
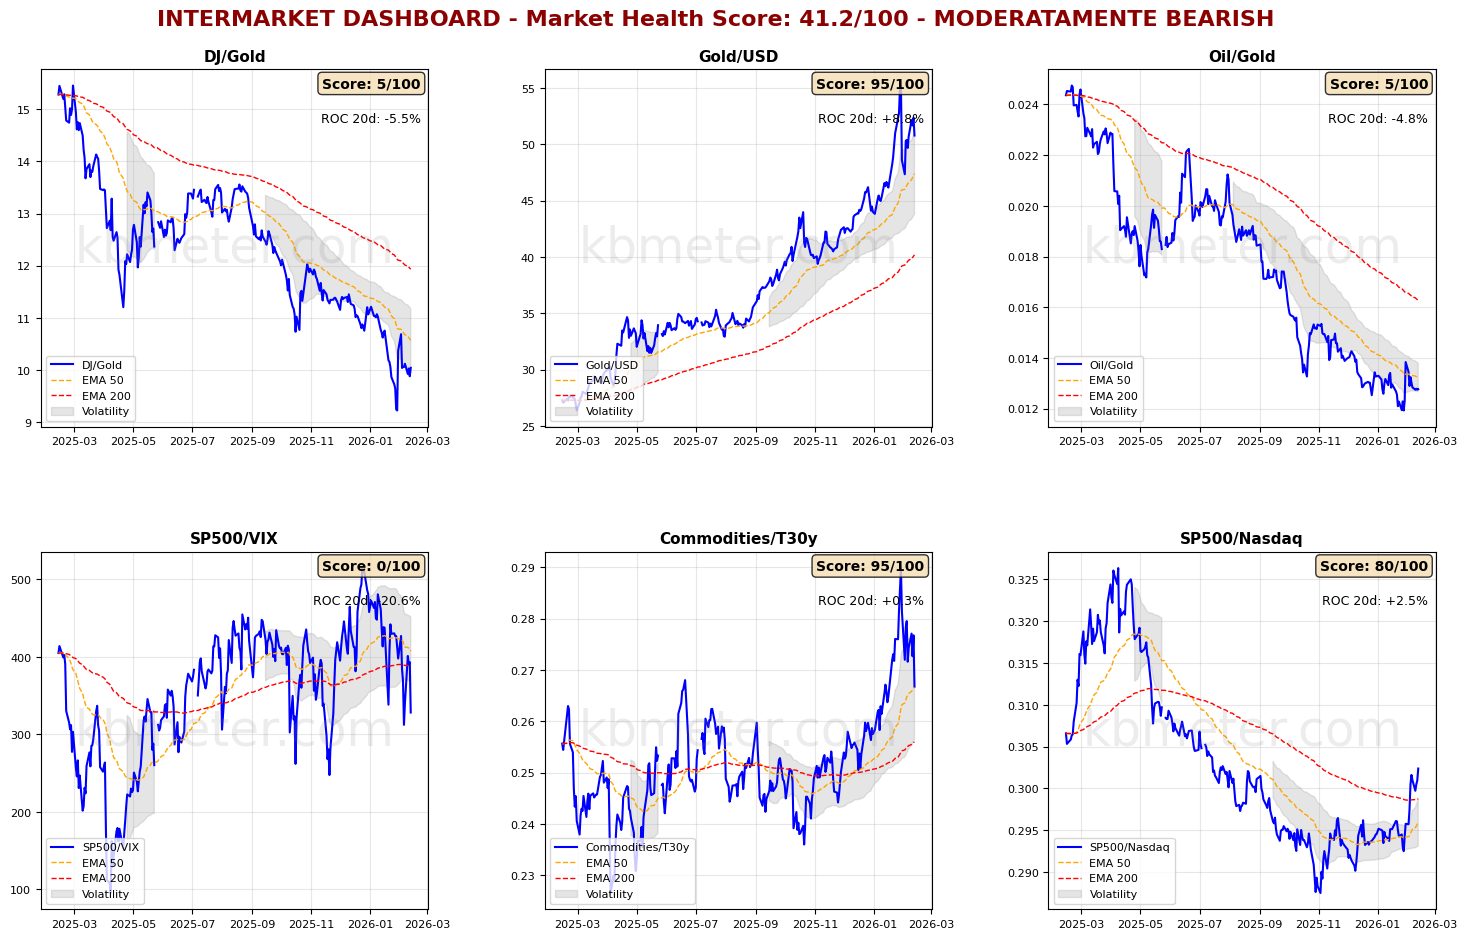
Financial markets are currently showing a neutral to slightly negative sentiment. Intermarket analysis highlights a Market Health Score of 41/100 (moderately negative). Our intermarket dashboards continue to point to a phase of heightened uncertainty and risk-off conditions, with risk indicators remaining at rather depressed levels. Gold does not appear to be accelerating again but remains stable, while bonds are once again drawing attention.
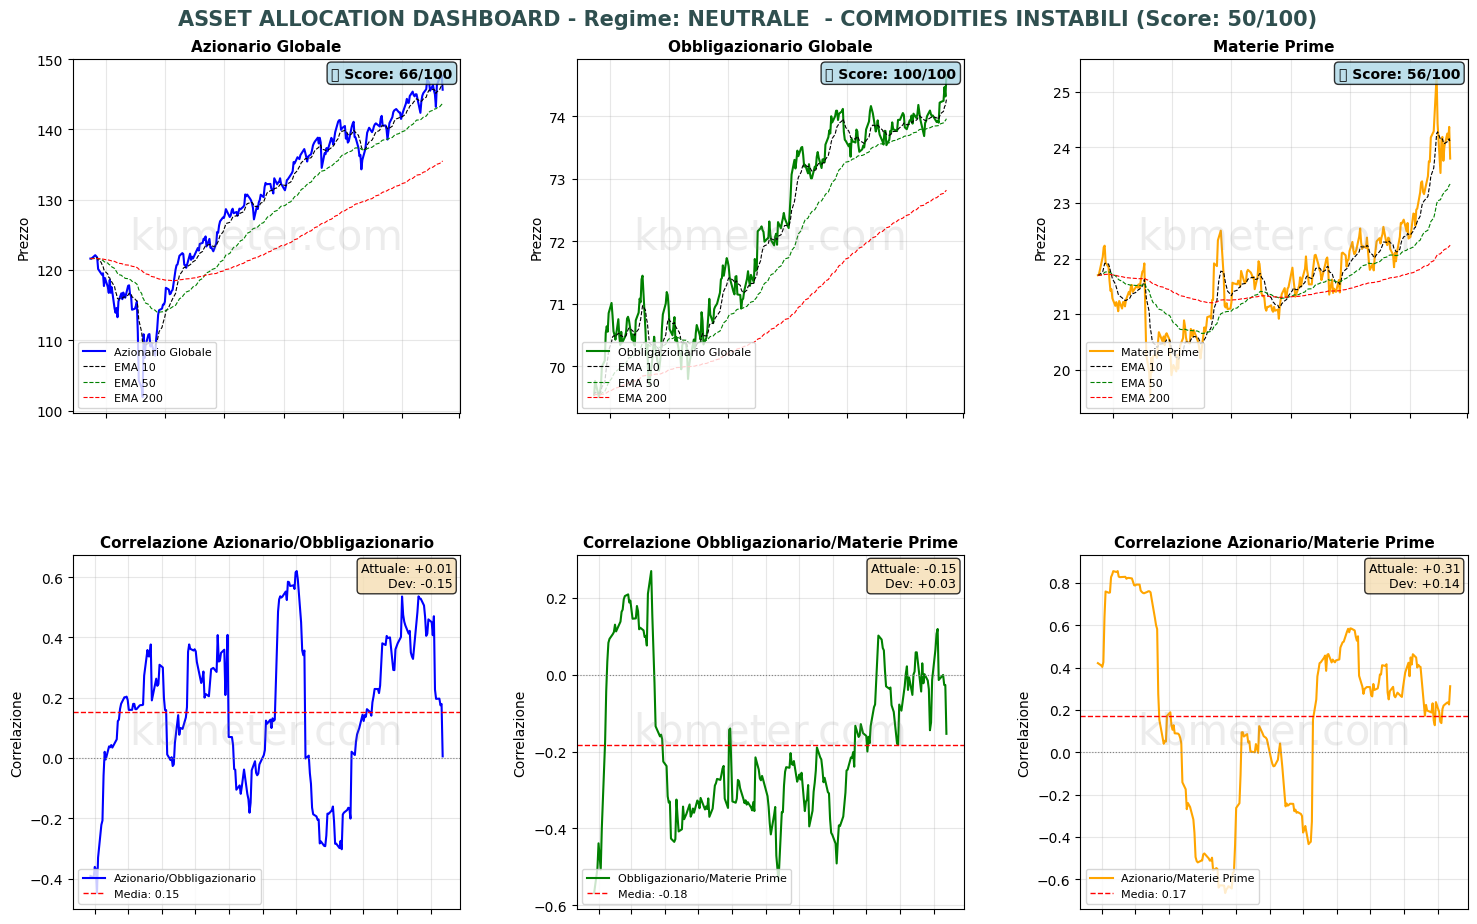
The market is in a neutral phase, with the three main asset classes showing mixed signals across the short, medium, and long term. Correlations are hovering near zero, signaling independent movements.
Pre-Opening Futures: Global futures indicate a moderate risk-off sentiment (average -0.10%), with the U.S. slightly negative (-0.22%), Europe slightly negative (-0.04%), and Asia slightly negative (-0.13%).
📊 Global Futures – Pre-Opening Sentiment
- TecDAX derived: +0.83%
- Nikkei 225 derived: +0.40%
- Mini DAX: +0.24%
- Hang Seng derived: -0.86%
- FTSE MIB derived: -0.62%
- IBEX 35 derived: -0.60%
📄 Detailed Intermarket Analysis
INTERMARKET ANALYSIS - 2026-02-13
============================================================

MARKET HEALTH SCORE: 41.2/100
SENTIMENT: MODERATELY BEARISH

============================================================
SUMMARY OF MAIN RATIOS
============================================================


DJ/Gold:
  - Component score: 5.0/100
  - Current value: 10.0437
  - Position vs EMA50: BELOW
  - 20-day ROC: -5.46%
  - 50-day ROC: -9.96%
  → Flight to safe haven

Gold/USD:
  - Component score: 95.0/100
  - Current value: 50.7965
  - Position vs EMA50: ABOVE
  - 20-day ROC: +8.84%
  - 50-day ROC: +19.12%

Oil/Gold:
  - Component score: 5.0/100
  - Current value: 0.0128
  - Position vs EMA50: BELOW
  - 20-day ROC: -4.80%
  - 50-day ROC: -8.79%
  → Declining energy demand

SP500/VIX:
  - Component score: 0.0/100
  - Current value: 328.1825
  - Position vs EMA50: BELOW
  - 20-day ROC: -20.64%
  - 50-day ROC: -16.95%
  - ⚠️ ANOMALY DETECTED - Significant deviation from the mean
  → Contracting risk appetite

Commodities/T30y:
  - Component score: 95.0/100
  - Current value: 0.2667
  - Position vs EMA50: ABOVE
  - 20-day ROC: +0.34%
  - 50-day ROC: +5.05%
  → Economic growth expectations

SP500/Nasdaq:
  - Component score: 80.0/100
  - Current value: 0.3024
  - Position vs EMA50: ABOVE
  - 20-day ROC: +2.46%
  - 50-day ROC: +3.31%
  - ⚠️ ANOMALY DETECTED - Significant deviation from the mean

============================================================
CONCLUSIONS AND RECOMMENDATIONS
============================================================

The market shows signs of weakness. Several ratios are in negative territory.
Risk appetite is declining. Increase caution.
Positioning: DEFENSIVE, favor safe havens.


STRONGEST RATIOS:
  • Gold/USD: 95.0/100
  • Commodities/T30y: 95.0/100
  • SP500/Nasdaq: 80.0/100

WEAKEST RATIOS:
  • DJ/Gold: 5.0/100
  • Oil/Gold: 5.0/100
  • SP500/VIX: 0.0/100

============================================================
Analysis automatically generated by kbmeter.com
Date: 2026-02-13
📄 Detailed Asset Allocation Analysis
ASSET ALLOCATION & REGIME ANALYSIS - 2026-02-13
======================================================================

MARKET REGIME: NEUTRAL - UNSTABLE COMMODITIES
REGIME SCORE: 50.0/100

======================================================================
TREND AND VOLATILITY ANALYSIS
======================================================================

GLOBAL EQUITIES (ACWI):
  Short-Term Trend (5d): -0.43% | BELOW EMA 10
  Medium-Term Trend (20d): +0.45% | ABOVE EMA 50
  Long-Term Trend (60d): +6.03% | ABOVE EMA 200

  5d Volatility: 20.4%
  20d Volatility: 14.7%
  60d Volatility: 11.8%

COMMODITIES (DBC):
  Medium-Term Trend (20d): +2.59% | ABOVE EMA 50
  20d Volatility: 27.4%

ACWI/BND Correlation (30d): 0.006

REGIME INTERPRETATION:
The market is in a neutral phase. Mixed signals across short, medium, and long term,
or positive trends accompanied by elevated volatility.
Suggested positioning: BALANCED, wait for greater clarity.

⚠️ COMMODITIES ALERT: Commodities are showing high volatility. This may
indicate uncertainty about economic growth or unstable supply/demand dynamics.

======================================================================
ASSET RANKING - WHO IS PERFORMING BEST?
======================================================================

🥇 1. Global Bonds (BND) - SCORE: 100/100
     Price: $74.66
     Trend: ABOVE EMA10 | ABOVE EMA50 | ABOVE EMA200
     Performance: 5d +0.58% | 20d +0.79% | 60d +1.61%
     Volatility: 5d 4.1% | 20d 3.3% | 60d 2.9%
     Drawdown: 0.00%
     → Asset in STRONG HEALTH: positive trends and controlled volatility

🥈 2. Global Equities (ACWI) - SCORE: 66/100
     Price: $145.65
     Trend: BELOW EMA10 | ABOVE EMA50 | ABOVE EMA200
     Performance: 5d -0.43% | 20d +0.45% | 60d +6.03%
     Volatility: 5d 20.4% | 20d 14.7% | 60d 11.8%
     Drawdown: -1.39%
     → Asset in FAIR condition: predominantly positive signals

🥉 3. Commodities (DBC) - SCORE: 56/100
     Price: $23.80
     Trend: BELOW EMA10 | ABOVE EMA50 | ABOVE EMA200
     Performance: 5d -0.87% | 20d +2.59% | 60d +7.24%
     Volatility: 5d 23.4% | 20d 27.4% | 60d 18.9%
     Drawdown: -5.93%
     → Asset in FAIR condition: predominantly positive signals

======================================================================
CORRELATION ANALYSIS - CURRENT vs HISTORICAL
======================================================================

ACWI/BND:
  Current correlation (30d): +0.006
  Historical average (1 year): +0.152
  Deviation: -0.147
  → Weak correlation: moderate diversification

BND/DBC:
  Current correlation (30d): -0.154
  Historical average (1 year): -0.183
  Deviation: +0.030

ACWI/DBC:
  Current correlation (30d): +0.312
  Historical average (1 year): +0.172
  Deviation: +0.140

======================================================================
OPERATIONAL SUMMARY
======================================================================

STRONGEST ASSET: Global Bonds (Score: 100/100)
WEAKEST ASSET: Commodities (Score: 56/100)

SUGGESTED ACTION: Balanced approach, diversify across asset classes.
DIVERSIFICATION: EXCELLENT - Asset classes are moving independently.

======================================================================
Analysis automatically generated by kbmeter.com
Date: 2026-02-13
On the macro front, the day features the important release of U.S. January inflation data. Also noteworthy are the final Spanish inflation reading, Eurozone employment data for the fourth quarter of 2025, and the second estimate of Eurozone growth for the last quarter of 2025.
On the earnings front, the day is relatively “quiet.” Notable reports include results from Capgemini and Moderna.
Already a subscriber? Login here
NOTES AND WARNINGS
Analysis automatically generated by kbmeter.com. Analysis date: 13 February 2026 - 7:33 AM GMT+1
This content is provided for informational purposes only and should not be considered financial advice. All scores and assessments are based on the previous trading day’s closing prices. Futures indications refer to the date and time of the analysis.